Fig. E.1
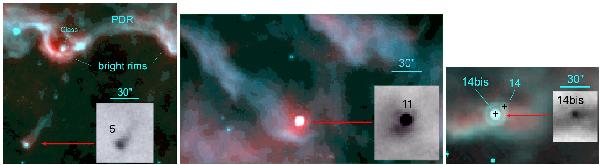
Colour composite images of three isolated sources discussed in the text. Red is the Herschel 100 μm emission and turquoise is for Spitzer 8.0 μm emission (isolated 5 and 11) or the 24 μm emission (isolated 14bis). The grey inserts show, at the same scale, the 100 μm source.
Current usage metrics show cumulative count of Article Views (full-text article views including HTML views, PDF and ePub downloads, according to the available data) and Abstracts Views on Vision4Press platform.
Data correspond to usage on the plateform after 2015. The current usage metrics is available 48-96 hours after online publication and is updated daily on week days.
Initial download of the metrics may take a while.