Fig. D.4
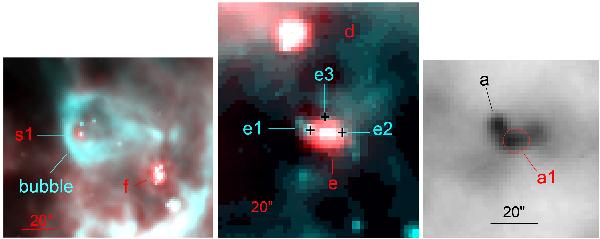
Features discussed in the text. Left: colour composite image of a small bubble; red is the 24 μm image, turquoise is the Spitzer 8.0 μm image showing the PAH emission. Middle: YSO IB-e and its vicinity; red is the 100 μm emission, turquoise is 8.0 μm emission. Right: YSO-a; the underlying grey image is the 100 μm emission, the red contour shows the position of the 24 μm Class I source a1.
Current usage metrics show cumulative count of Article Views (full-text article views including HTML views, PDF and ePub downloads, according to the available data) and Abstracts Views on Vision4Press platform.
Data correspond to usage on the plateform after 2015. The current usage metrics is available 48-96 hours after online publication and is updated daily on week days.
Initial download of the metrics may take a while.