Fig. D.3
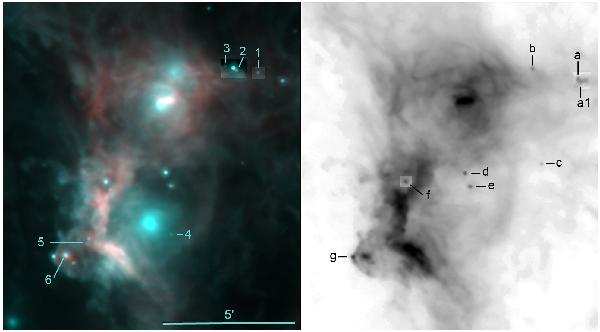
Colour composite image of the region between W5-E and W5-W. Left: red is the Herschel-PACS emission at 100 μm, and turquoise is the Spitzer-MIPS emission at 24 μm. Right: the point sources detected at 100 μm and discussed in the text are identified on a grey-scale image of the 100 μm emission (given in logarithmic units).
Current usage metrics show cumulative count of Article Views (full-text article views including HTML views, PDF and ePub downloads, according to the available data) and Abstracts Views on Vision4Press platform.
Data correspond to usage on the plateform after 2015. The current usage metrics is available 48-96 hours after online publication and is updated daily on week days.
Initial download of the metrics may take a while.