Free Access
Fig. 3
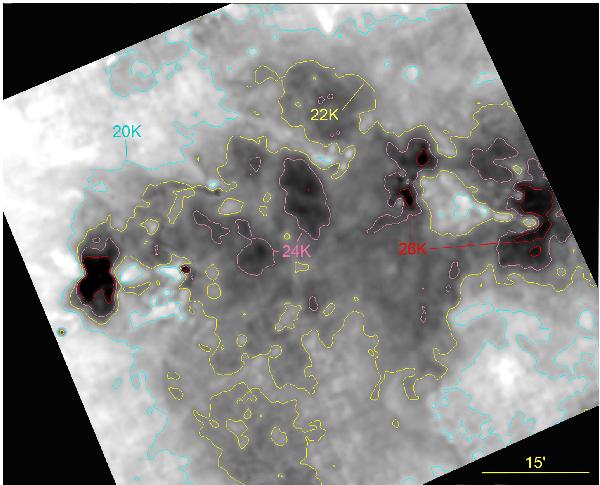
Temperature map of W5. Iso-temperature contours (20 K in blue, 22 K in yellow, 24 K in pink, and 26 K in red) are superimposed on the grey-scale temperature map. The resolution is that of the 500 μm map, 37″. North is up and east is left.
Current usage metrics show cumulative count of Article Views (full-text article views including HTML views, PDF and ePub downloads, according to the available data) and Abstracts Views on Vision4Press platform.
Data correspond to usage on the plateform after 2015. The current usage metrics is available 48-96 hours after online publication and is updated daily on week days.
Initial download of the metrics may take a while.