Fig. C.4
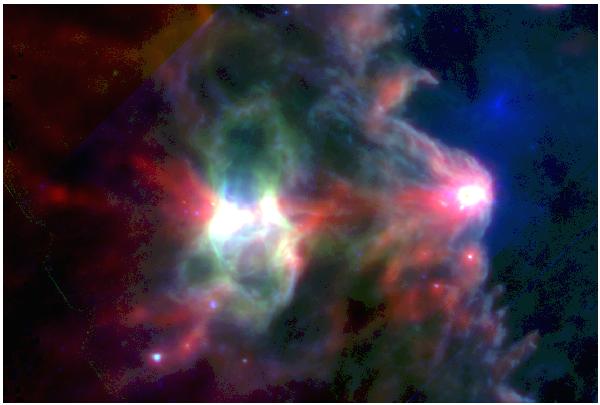
Vicinity of Sh 201 and BRC14. Composite colour image with the Herschel-SPIRE 500 μm image in red, the Herschel-PACS 100 μm image in green and the Spitzer-MIPS 24 μm image in blue (all in logarithmic units). Red is the emission of the cold dust; it shows the dense material in this region. Green traces the emission from warmer dust in the PDRs of the H ii regions. Blue traces the emission from even hotter dust, located in the PDRs but also inside the ionized regions. YSOs appear as point sources at 24 μm and 100 μm. The field is 32.5′ × 21.8′. North is up and east is left.
Current usage metrics show cumulative count of Article Views (full-text article views including HTML views, PDF and ePub downloads, according to the available data) and Abstracts Views on Vision4Press platform.
Data correspond to usage on the plateform after 2015. The current usage metrics is available 48-96 hours after online publication and is updated daily on week days.
Initial download of the metrics may take a while.