Fig. C.3
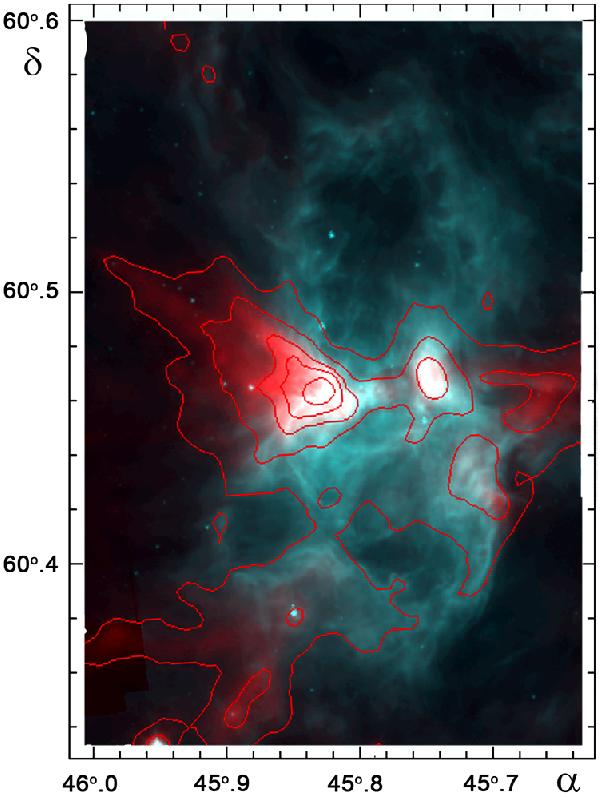
Bipolar nature of Sh 201. Red is for the column density map; the red contours are of column density; the peak column density is 6.2 × 1022 cm-2 (east condensation) and the contours levels are 0.1, 0.25, 0.5, 1, 2.5, and 5 × 1022 cm-2. Turquoise is for the Spitzer 8.0 μm image showing the PAH emission from the vicinity of the ionization front. The coordinates are J2000 in degrees.
Current usage metrics show cumulative count of Article Views (full-text article views including HTML views, PDF and ePub downloads, according to the available data) and Abstracts Views on Vision4Press platform.
Data correspond to usage on the plateform after 2015. The current usage metrics is available 48-96 hours after online publication and is updated daily on week days.
Initial download of the metrics may take a while.