Fig. C.1
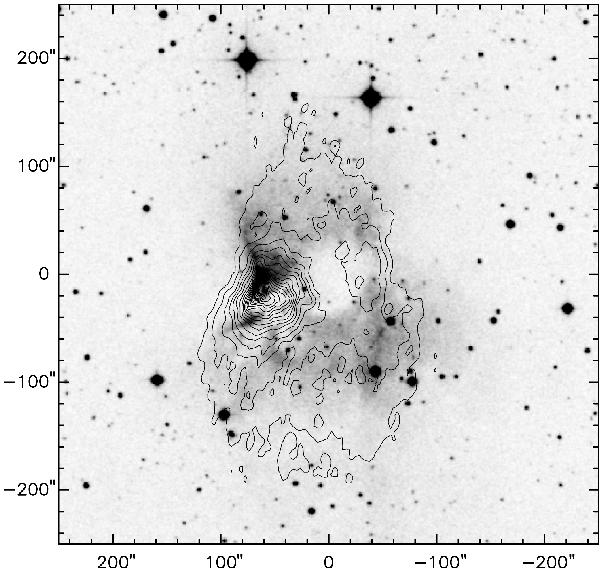
Emission of the ionized gas in Sh 201. The contours of the radio-continuum emission, as given by Ojha et al. (2004; their Fig. 6), are superimposed on a grey image of the Hα emission (DSS-2 red image). The brightest emission comes from the dense ionized layer bordering a molecular condensation. North is up and east is left.
Current usage metrics show cumulative count of Article Views (full-text article views including HTML views, PDF and ePub downloads, according to the available data) and Abstracts Views on Vision4Press platform.
Data correspond to usage on the plateform after 2015. The current usage metrics is available 48-96 hours after online publication and is updated daily on week days.
Initial download of the metrics may take a while.