Fig. 2
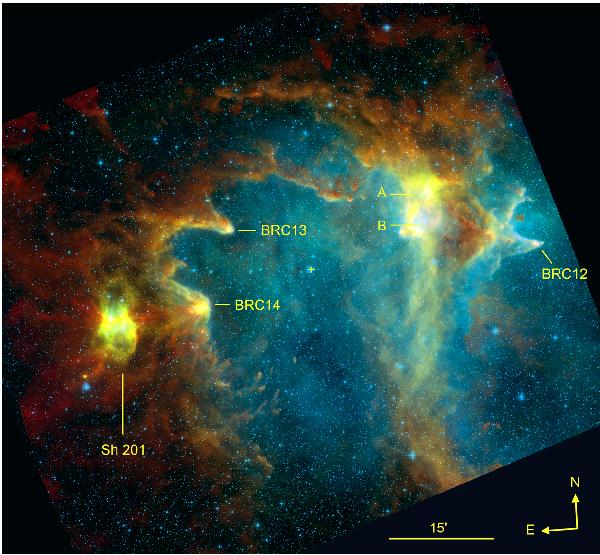
Composite colour image of the W5-E field observed by Herschel. Red is the 250 μm Herschel-SPIRE data, which traces cold dust emission, green is the 100 μm Herschel-PACS data, which traces emission mainly from dust at higher temperature located in the PDRs, and blue is the DSS2-red survey, which traces the Hα emission of the ionized gas. The yellow cross lies at the position of HD 18326, the exciting star of W5-E.
Current usage metrics show cumulative count of Article Views (full-text article views including HTML views, PDF and ePub downloads, according to the available data) and Abstracts Views on Vision4Press platform.
Data correspond to usage on the plateform after 2015. The current usage metrics is available 48-96 hours after online publication and is updated daily on week days.
Initial download of the metrics may take a while.