Free Access
Fig. B.1
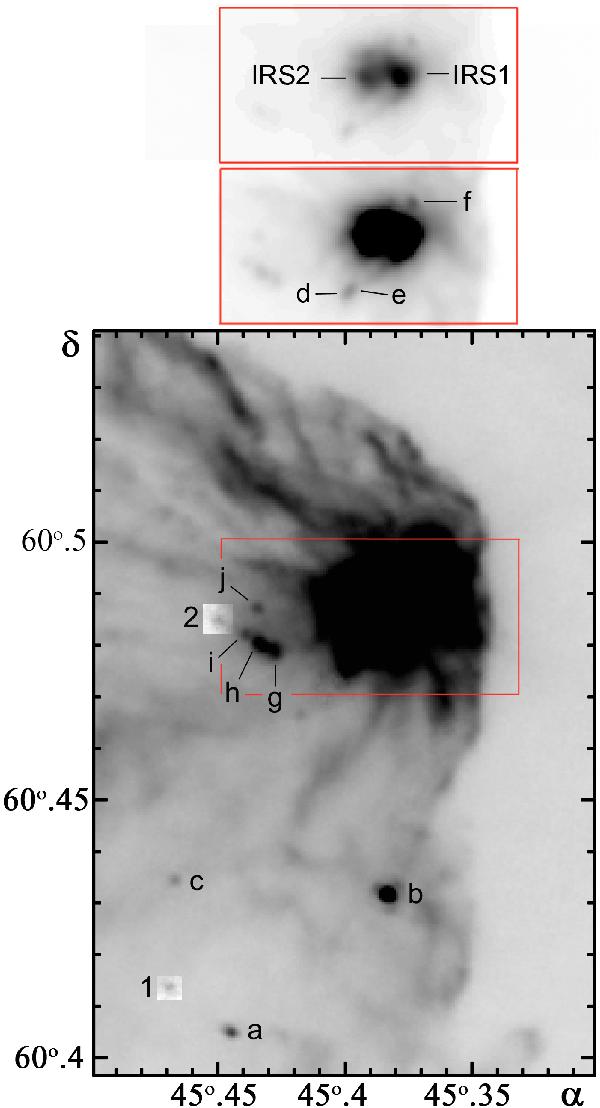
Identification of the YSOs in the BRC14 field. The grey-scale image shows the Herschel-PACS 100 μm emission. The three red boxes show the same zone, displayed with different intensity cuts to allow the identification of all the central sources.
Current usage metrics show cumulative count of Article Views (full-text article views including HTML views, PDF and ePub downloads, according to the available data) and Abstracts Views on Vision4Press platform.
Data correspond to usage on the plateform after 2015. The current usage metrics is available 48-96 hours after online publication and is updated daily on week days.
Initial download of the metrics may take a while.