Fig. 1
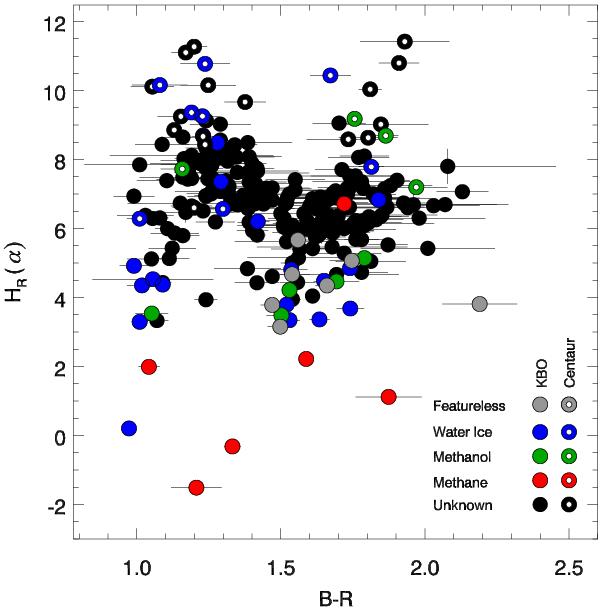
B − R vs.
HR(α) plot of all 253
objects. KBOs are represented by solid circles and Centaurs by white dotted solid
circles. Objects with  separate into two color groups with a “gap” centered at
B − R ~ 1.60. Objects with
separate into two color groups with a “gap” centered at
B − R ~ 1.60. Objects with
 also show statistical evidence of a separation into two-color groups but with a “gap”
centered at B − R ~ 1.25. Objects spectra with
known features of water ice, methane, methanol, and featureless spectra, are coded
using colors as described in the legend. There is no obvious/clear connection between
B − R colors and the presence of spectral
features.
also show statistical evidence of a separation into two-color groups but with a “gap”
centered at B − R ~ 1.25. Objects spectra with
known features of water ice, methane, methanol, and featureless spectra, are coded
using colors as described in the legend. There is no obvious/clear connection between
B − R colors and the presence of spectral
features.
Current usage metrics show cumulative count of Article Views (full-text article views including HTML views, PDF and ePub downloads, according to the available data) and Abstracts Views on Vision4Press platform.
Data correspond to usage on the plateform after 2015. The current usage metrics is available 48-96 hours after online publication and is updated daily on week days.
Initial download of the metrics may take a while.