Fig. 5
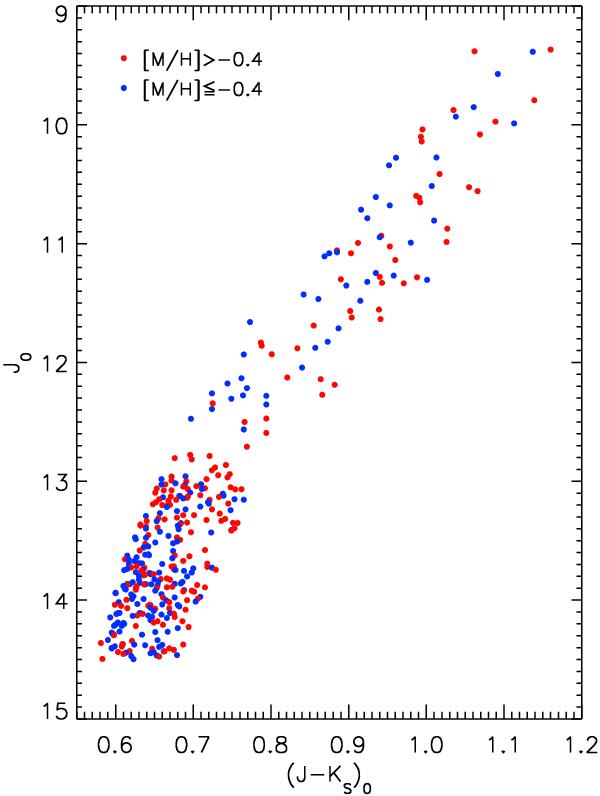
Colour–magnitude diagram of our sample stars, with the metallicity colour-coded as indicated in the legend. The sample was divided at [M/H] = −0.4 into two approximately equally large parts. In particular on the upper RGB, metal-rich stars are preferentially located at the red edge of the selection region, whereas metal-poor stars are preferentially at the blue edge.
Current usage metrics show cumulative count of Article Views (full-text article views including HTML views, PDF and ePub downloads, according to the available data) and Abstracts Views on Vision4Press platform.
Data correspond to usage on the plateform after 2015. The current usage metrics is available 48-96 hours after online publication and is updated daily on week days.
Initial download of the metrics may take a while.