Fig. 2
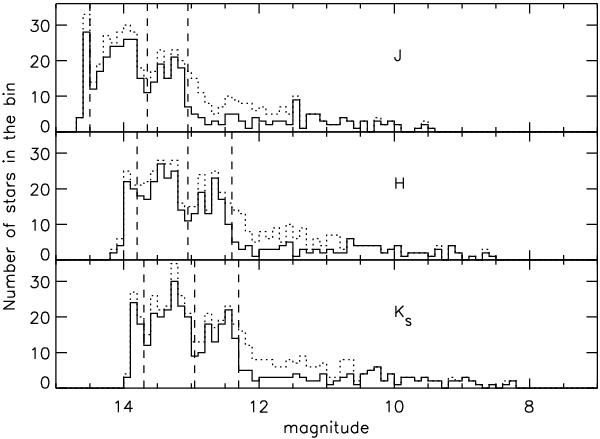
Histograms of the observed (not de-reddened) 2MASS magnitudes of our sample stars. The dotted line shows the histograms of all stars in the selection region (527 stars, including those that did not fulfil the quality flag criteria to be selected as target), the solid line shows the histogram of the 401 stars for which the radial velocity could be determined. The vertical dashed lines indicate the magnitude limits that were adopted to define the memberships in the two RCs (Sect. 2.2). The double RC is clearly visible in all three bands.
Current usage metrics show cumulative count of Article Views (full-text article views including HTML views, PDF and ePub downloads, according to the available data) and Abstracts Views on Vision4Press platform.
Data correspond to usage on the plateform after 2015. The current usage metrics is available 48-96 hours after online publication and is updated daily on week days.
Initial download of the metrics may take a while.