Fig. 17
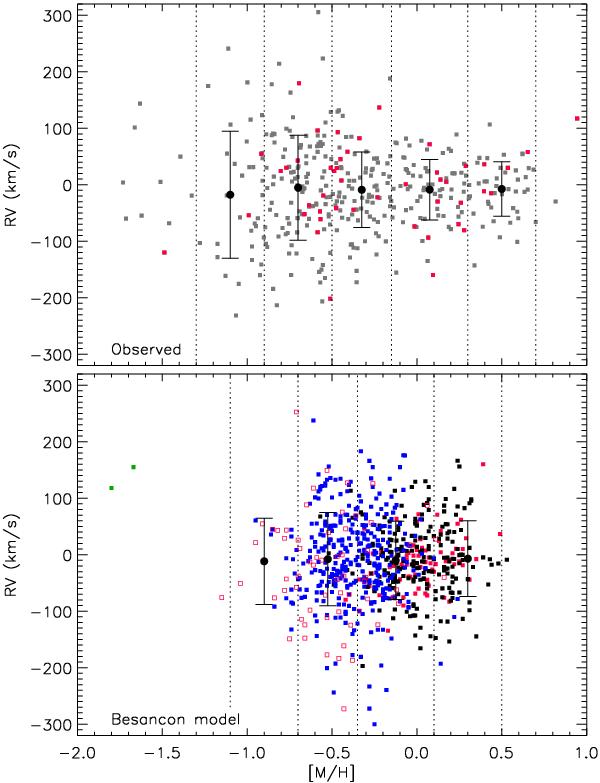
Radial velocity versus metallicity. Top panel: observed sample stars. Foreground star candidates are represented by red squares, all other stars by grey squares. Bottom panel: simulated stars in the Besançon model (Robin et al. 2012). Blue squares represent the thick bulge, black squares the bar, filled red squares the thin disc, open red squares the thick disc, and green symbols represent the halo population. The over-plotted error-bar symbols in both panels show the mean and standard deviation of the RV over the metallicity range between the vertical dotted lines.
Current usage metrics show cumulative count of Article Views (full-text article views including HTML views, PDF and ePub downloads, according to the available data) and Abstracts Views on Vision4Press platform.
Data correspond to usage on the plateform after 2015. The current usage metrics is available 48-96 hours after online publication and is updated daily on week days.
Initial download of the metrics may take a while.