Fig. 12
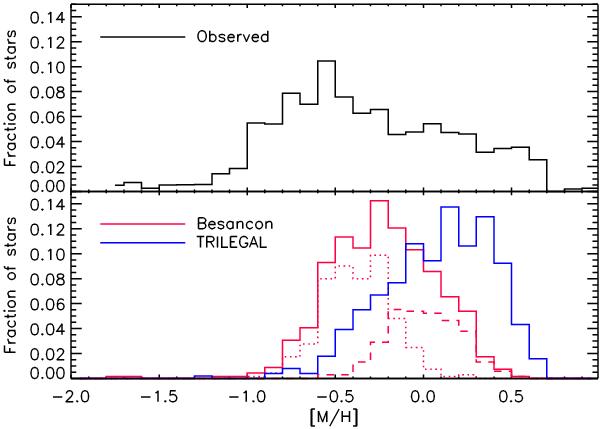
Comparison of the observed MDF corrected for sampling effects (upper panel), with the ones predicted by the Besançon and TRILEGAL models in the selection region (lower panel). The histograms are normalised to the same area. In the lower panel, the red dotted line shows the MDF of “thick bulge” stars in the Besançon model, whereas the dashed red line is the one for the bar component.
Current usage metrics show cumulative count of Article Views (full-text article views including HTML views, PDF and ePub downloads, according to the available data) and Abstracts Views on Vision4Press platform.
Data correspond to usage on the plateform after 2015. The current usage metrics is available 48-96 hours after online publication and is updated daily on week days.
Initial download of the metrics may take a while.