Fig. 8
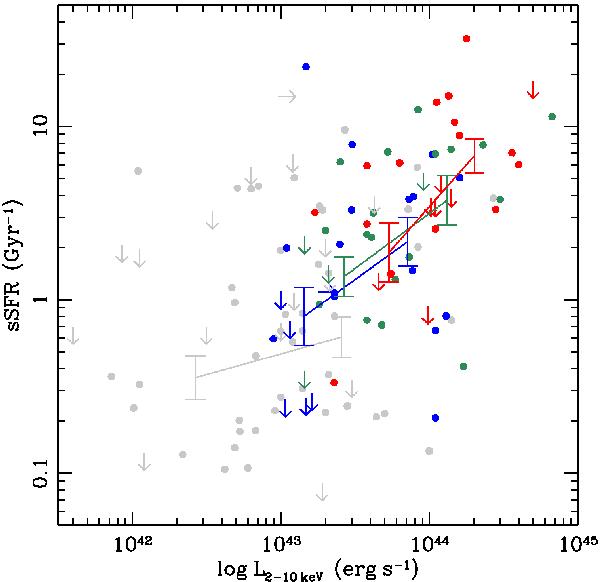
Specific star-formation rate against hard X-ray luminosity for X-ray selected AGNs. The grey, blue, green and red symbols refer to z < 1.120, 1.120 < z < 1.615, 1.615 < z < 2.455 and z > 2.455, respectively. The error-bars and their associated lines refer to the mean luminosities and specific SFRs of the high- and low-luminosity bins within each redshift bin, using the Kaplan-Meier estimator (see Sect. 4.1). We do not detect a significant correlation between the X-ray luminosity and sSFR for the lowest redshift bin, but do detect a significant correlation for higher redshifts (z ≳ 1).
Current usage metrics show cumulative count of Article Views (full-text article views including HTML views, PDF and ePub downloads, according to the available data) and Abstracts Views on Vision4Press platform.
Data correspond to usage on the plateform after 2015. The current usage metrics is available 48-96 hours after online publication and is updated daily on week days.
Initial download of the metrics may take a while.