Fig. 3
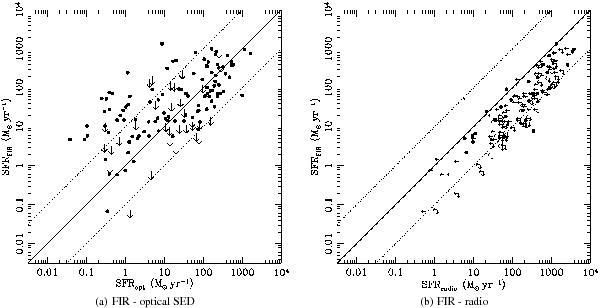
Comparison of the star formation rates of X-ray sources, measured using the infrared 8−1000 μm luminosity, and the optical SED fitting a), or the 1.4 GHz radio luminosity b). Black circles mark reliable fits in both optical and far-infrared (or radio) wavelengths, excluding cases where the AGN SED dominates even the longest wavelength flux density available. Sources spanning over the whole 3 Ms XMM-Newton region are used in these plots, while the downward arrows refer to Herschel non-detections in the PACS area (35 cases), and leftward arrows in the right panel refer to radio upper limits spanning over the whole XMM-Newton region (112 cases). The solid and dashed lines in both panels represent the 1:1 relation and the ±1 dex deviation, respectively, and the vertical dashed line in the right panel marks the calculated star-formation rate of a source having L1.4 GHz = 1024.5 W Hz-1 = 1031.5 erg s-1 Hz-1. The significant deviation form the 1:1 relation of both cases and the significant scatter of the optical SED (left) case prevent us from using any of the two SFR tracers in this paper.
Current usage metrics show cumulative count of Article Views (full-text article views including HTML views, PDF and ePub downloads, according to the available data) and Abstracts Views on Vision4Press platform.
Data correspond to usage on the plateform after 2015. The current usage metrics is available 48-96 hours after online publication and is updated daily on week days.
Initial download of the metrics may take a while.