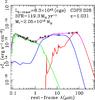
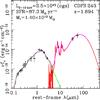
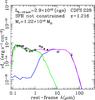
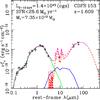
Fig. 2
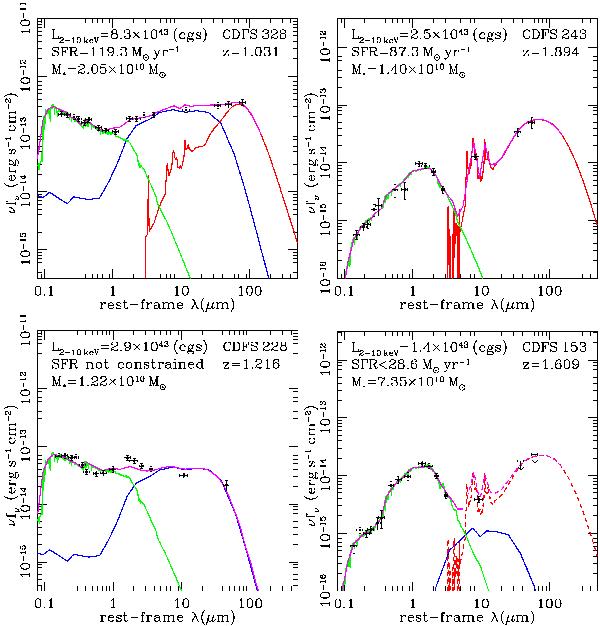
Examples of the SED fitting used to derive stellar masses and star-formation rates, selected to demonstrate the diversity in the SEDs of the X-ray sample. The star-formation component is plotted in red, the AGN component in blue, and the stellar component in green. In magenta we plot the combination fitted to the data-points. The stellar component is only confined by the optical wavelengths where it usually dominates the flux, but there are cases where we detect a substantial AGN contribution. The star-formation component is confined by the FIR flux with rest-frame wavelength >20 μm, and again there are cases where the FIR flux is dominated by the AGN. With downward arrows we plot far-IR upper limits (see Sect. 3.3), where the resulting starburst component is plotted with a dashed line. The numbering in the top-right corners of the panels refers to the preliminary XMM-Newton catalogue number.
Current usage metrics show cumulative count of Article Views (full-text article views including HTML views, PDF and ePub downloads, according to the available data) and Abstracts Views on Vision4Press platform.
Data correspond to usage on the plateform after 2015. The current usage metrics is available 48-96 hours after online publication and is updated daily on week days.
Initial download of the metrics may take a while.