Fig. 12
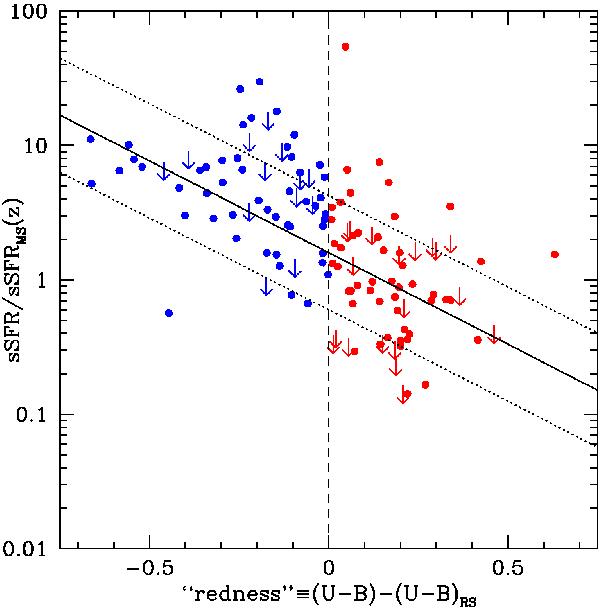
Starburstiness against deviation from the dividing line between red and blue galaxies for the sources of our sample. With blue and red symbols are plotted galaxies in the blue cloud and the green valley, and red-sequence galaxies respectively; the dividing line (the border of the red sequence) is the dashed vertical line, calculated from the parametrisation of Peng et al. (2010). The lines denote the best-fit model and its standard deviation, according to Eq. (5).
Current usage metrics show cumulative count of Article Views (full-text article views including HTML views, PDF and ePub downloads, according to the available data) and Abstracts Views on Vision4Press platform.
Data correspond to usage on the plateform after 2015. The current usage metrics is available 48-96 hours after online publication and is updated daily on week days.
Initial download of the metrics may take a while.