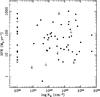
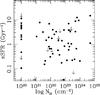
Fig. 11
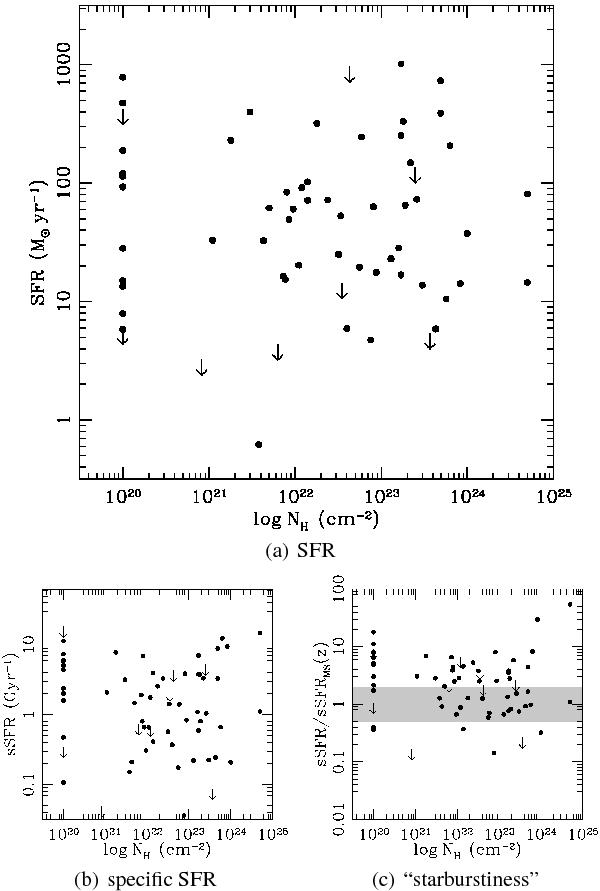
Star-formation rate, specific star-formation rate, and “starburstiness” plotted against the hydrogen column density for 65 sources with XMM-Newton spectra and robust SED fitting (including nine with Herschel upper limits). The grey area in panel c) is the main-sequence, as in Figs. 9 and 10. The errors on the hydrogen column density are in the range of ≲10% to 30%. We do not detect any significant correlation between the two values, even if we split the sample into redshift or luminosity bins, in any of the three plots.
Current usage metrics show cumulative count of Article Views (full-text article views including HTML views, PDF and ePub downloads, according to the available data) and Abstracts Views on Vision4Press platform.
Data correspond to usage on the plateform after 2015. The current usage metrics is available 48-96 hours after online publication and is updated daily on week days.
Initial download of the metrics may take a while.