Fig. 1
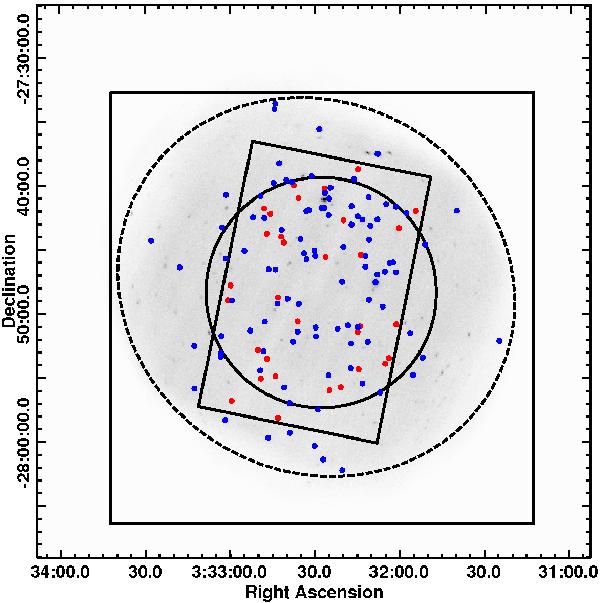
Spatial limits of the different surveys used in this work. The grey-scale image is the combined 2–10 keV 3 Ms image of the XMM-Newton observations, and the regions are the Herschel area (small rectangle), the 4 Ms Chandra area (solid circle), the XMM-Newton area used (dashed circle) and the E-CDFS Chandra area (large square). The radio and Spitzer areas used are all wider than the E-CDFS. The Herschel and the XMM-Newton areas are the boundaries of the “complete” and “broad” samples, respectively (see Sect. 3.3). The sources of the “broad” sample are marked with blue symbols, whereas the sources with FIR flux density upper limits in the “complete” sample are marked with red symbols.
Current usage metrics show cumulative count of Article Views (full-text article views including HTML views, PDF and ePub downloads, according to the available data) and Abstracts Views on Vision4Press platform.
Data correspond to usage on the plateform after 2015. The current usage metrics is available 48-96 hours after online publication and is updated daily on week days.
Initial download of the metrics may take a while.