Fig. 6
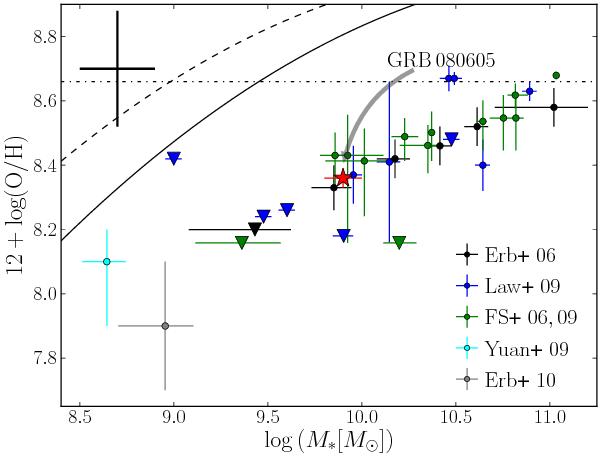
The host of GRB 080605 with respect to the mass − metallicity relation at z ~ 2. Different colored symbols represent the averaged galaxy distribution from Erb et al. (2006) in black, as well as individual sources from Förster Schreiber et al. (2006, 2009) in green, from Law et al. (2009) in blue and gravitationally lensed galaxies from Yuan & Kewley (2009) and Erb et al. (2010) in cyan and gray, respectively. Upper limits are shown with downward triangles with the same color-coding. All measurements are in the N2 scale of Pettini & Pagel (2004). The horizontal dashed-dotted line marks the solar oxygen abundance. The dashed line is the local M − Z relation (Tremonti et al. 2004), which is also shown shifted (solid line) to the observations at z ~ 0.7 (Savaglio et al. 2005). Approximate systematic errors on the N2 metallicity scale and the mass determination are indicated in the top left corner.
Current usage metrics show cumulative count of Article Views (full-text article views including HTML views, PDF and ePub downloads, according to the available data) and Abstracts Views on Vision4Press platform.
Data correspond to usage on the plateform after 2015. The current usage metrics is available 48-96 hours after online publication and is updated daily on week days.
Initial download of the metrics may take a while.