Fig. 3
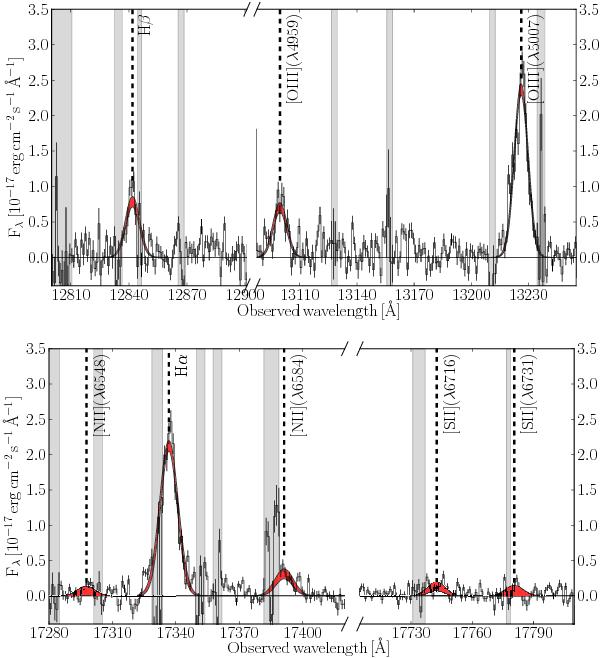
Continuum-subtracted emission lines used to determine the gas-phase metallicity in the X-shooter spectrum, as well as the [S ii] doublet. The black line shows the raw spectrum including errors, and the red-shaded areas denote the 90% confidence region of the fit of the emission lines using Gaussians. Grey shaded areas denote wavelength regions that have been omitted in the fitting due to skyline contamination.
Current usage metrics show cumulative count of Article Views (full-text article views including HTML views, PDF and ePub downloads, according to the available data) and Abstracts Views on Vision4Press platform.
Data correspond to usage on the plateform after 2015. The current usage metrics is available 48-96 hours after online publication and is updated daily on week days.
Initial download of the metrics may take a while.