Free Access
Fig. 2
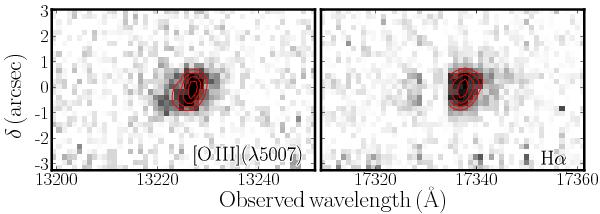
Two-dimensional cutouts of the X-shooter NIR spectrum centered on the observed wavelength of [O iii](λ5007) and Hα. Skylines are indicated with gray shading. Linearly spaced contours are shown in red lines.
Current usage metrics show cumulative count of Article Views (full-text article views including HTML views, PDF and ePub downloads, according to the available data) and Abstracts Views on Vision4Press platform.
Data correspond to usage on the plateform after 2015. The current usage metrics is available 48-96 hours after online publication and is updated daily on week days.
Initial download of the metrics may take a while.