Fig. 8
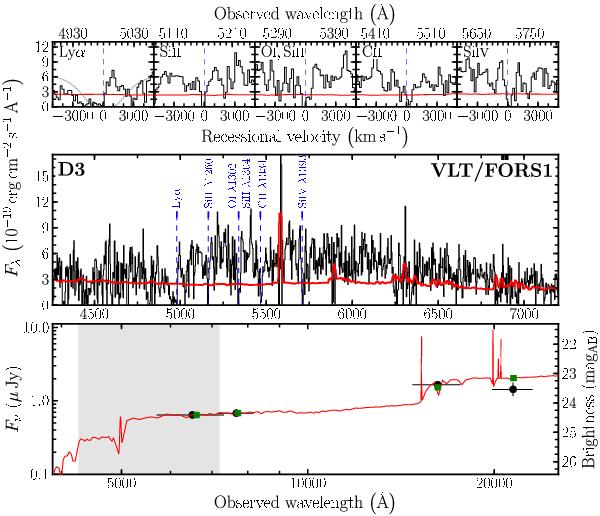
Spectrum (middle) and the SED (bottom) of the DLA galaxy D3 in the field of GRB 070721B. In the middle panel, the error spectrum is overplotted and several absorption lines are marked. Regions of strong telluric features (atmosphere transparency <20%) were not used in the spectral analysis and are marked by a small box at the top. The top panel shows zoom-ins on the individual absorption lines. In the bottom panel, the observed extinction-corrected data points are shown as circles with error bars. The curve represents the best fit to the observed SED. The model-predicted magnitudes (squares) are superposed. The grey area highlights the interval that is covered by the spectrum above.
Current usage metrics show cumulative count of Article Views (full-text article views including HTML views, PDF and ePub downloads, according to the available data) and Abstracts Views on Vision4Press platform.
Data correspond to usage on the plateform after 2015. The current usage metrics is available 48-96 hours after online publication and is updated daily on week days.
Initial download of the metrics may take a while.