Fig. 3
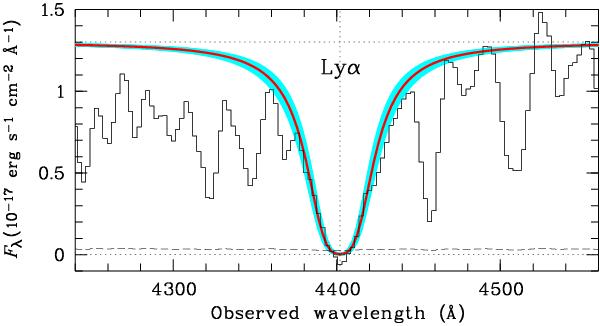
GRB 050908 afterglow spectrum obtained with VLT/FORS1, centred on the intervening Lyα absorption line (zDLA = 2.6208; log N(H i) = 20.8 ± 0.1). A neutral hydrogen column density fit to the damped Lyα line is shown with a solid line, while the shaded region indicates the 1σ errors.
Current usage metrics show cumulative count of Article Views (full-text article views including HTML views, PDF and ePub downloads, according to the available data) and Abstracts Views on Vision4Press platform.
Data correspond to usage on the plateform after 2015. The current usage metrics is available 48-96 hours after online publication and is updated daily on week days.
Initial download of the metrics may take a while.