Fig. A.2
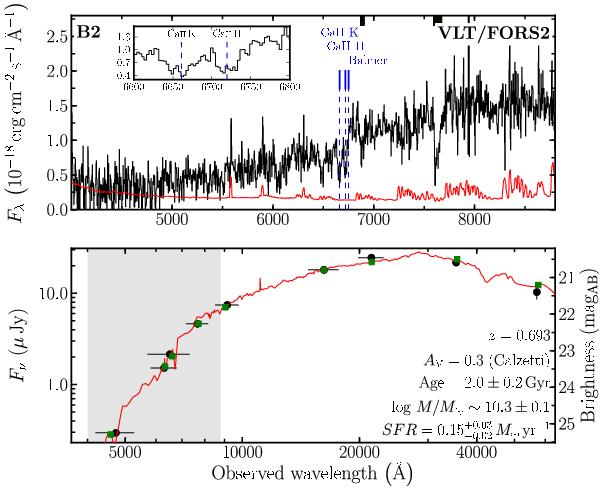
Galaxy B2 in the field of GRB 050820A. Top: spectrum acquired with VLT/FORS2. The identified Ca ii H&K absorption lines and the Balmer break are marked. The inset zooms-in on the position of the both absorption lines. Based on the identification of the three absorption features the redshift of the galaxy is z = 0.693. The error spectrum is overplotted. Regions of strong telluric features (atmosphere transparency <20%) are not used in the spectral analysis and are marked by small boxes at the top. Bottom: SED from g′-band to 5.8 μm. The observed data points (corrected Galactic extinction) are shown as circles with error bars. The solid line displays the best-fit model of the SED (χ2 = 16.3; number of filters =9). The model-predicted magnitudes are superposed (squares). The grey area highlights the interval that is covered by the spectrum above.
Current usage metrics show cumulative count of Article Views (full-text article views including HTML views, PDF and ePub downloads, according to the available data) and Abstracts Views on Vision4Press platform.
Data correspond to usage on the plateform after 2015. The current usage metrics is available 48-96 hours after online publication and is updated daily on week days.
Initial download of the metrics may take a while.