Fig. 4
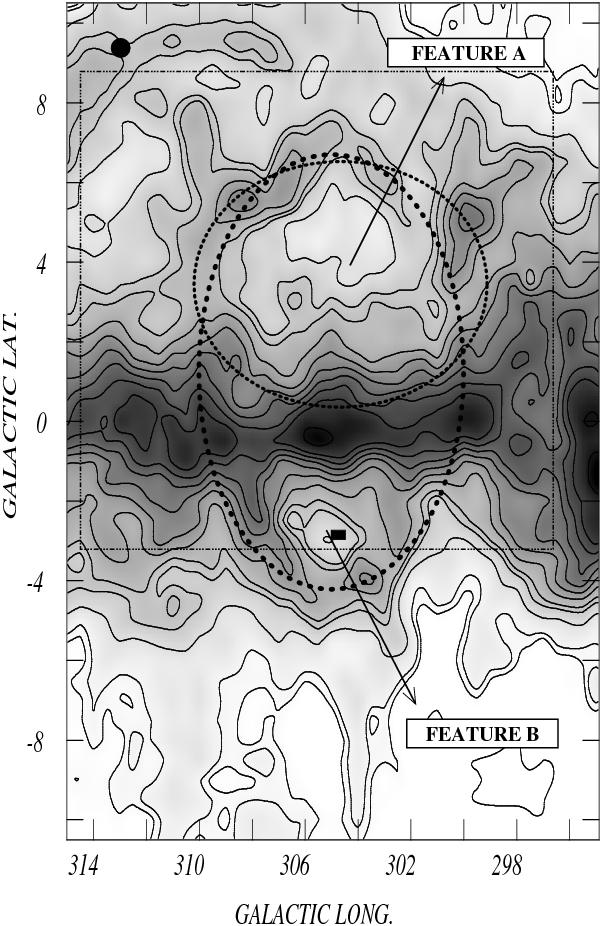
Grey-scale representation of the mean Hi brightness temperature in the
velocity range −26 to −19 km s-1. The light dot ellipse represents
the least square fit to the Hi peaks defining GS305+04-26. The location
of GSH305+01-24 (McClure-Griffiths et al.
2001) is depicted by a dark dot ellipse. The dash-dotted rectangle delimits
the region shown in Fig. 5. The small black
rectangle shows the position of the star WR 48,
 .
The angular resolution of these data is given by the filled dot drawn in the upper
left-hand corner.
.
The angular resolution of these data is given by the filled dot drawn in the upper
left-hand corner.
Current usage metrics show cumulative count of Article Views (full-text article views including HTML views, PDF and ePub downloads, according to the available data) and Abstracts Views on Vision4Press platform.
Data correspond to usage on the plateform after 2015. The current usage metrics is available 48-96 hours after online publication and is updated daily on week days.
Initial download of the metrics may take a while.