Fig. 2
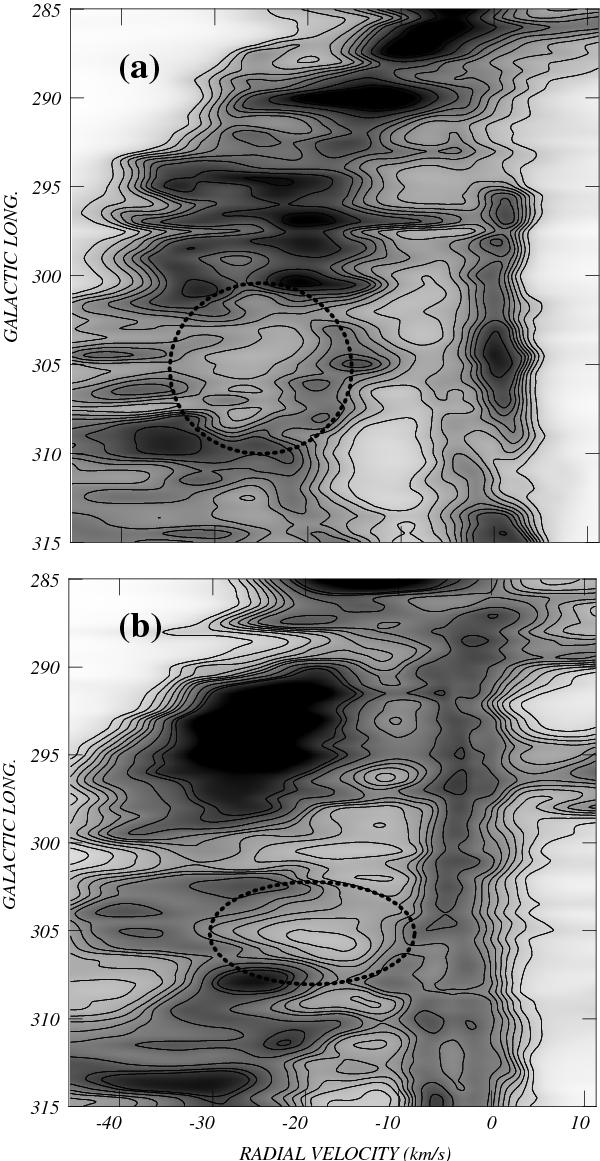
Velocity–galactic longitude diagram of the mean brightness temperature
distribution in two different ranges of galactic latitude. The upper panel
shows the velocity–galactic longitude diagram for
3 5 ≤
b ≤ 40. The dotted
circumference signals the location of Feature A (see text). The lower
panel shows the same diagram for the galatic latitude strip
–30 ≤
b ≤ –25. The dotted
ellipse marks the location of Feature B.
5 ≤
b ≤ 40. The dotted
circumference signals the location of Feature A (see text). The lower
panel shows the same diagram for the galatic latitude strip
–30 ≤
b ≤ –25. The dotted
ellipse marks the location of Feature B.
Current usage metrics show cumulative count of Article Views (full-text article views including HTML views, PDF and ePub downloads, according to the available data) and Abstracts Views on Vision4Press platform.
Data correspond to usage on the plateform after 2015. The current usage metrics is available 48-96 hours after online publication and is updated daily on week days.
Initial download of the metrics may take a while.