Fig. 1
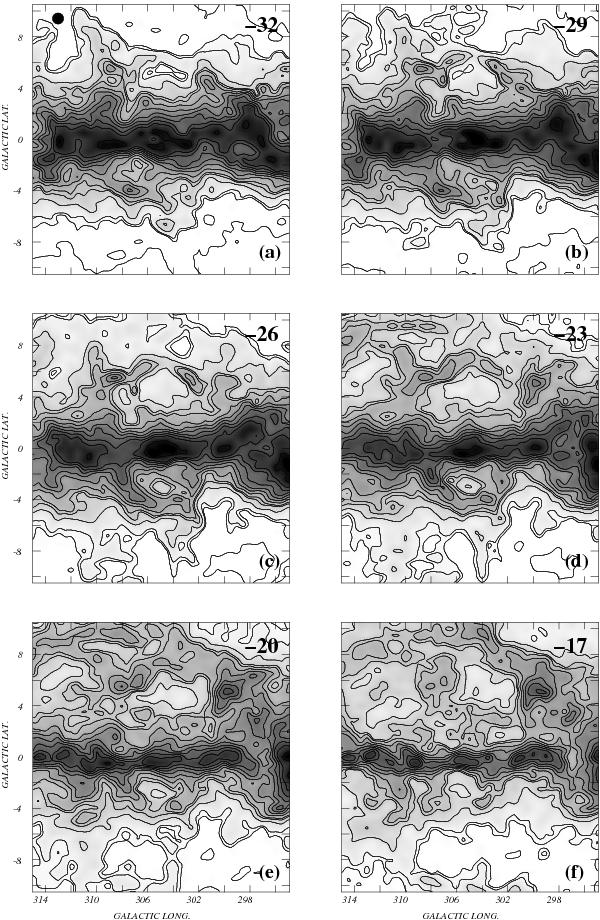
Mosaic of Hi mean brightness temperature in selected velocity ranges within −33 to −16 km s-1. Each image is a mean of three individual images. The central velocity of each image is indicated at the inner top right-hand corner. The filled circle drawn in the upper left-hand corner of the Hi image at −32 km s-1 indicates the angular resolution of the Hi data. The lowest and highest contours are 15 K and 105 K, respectively, while the contour spacing is 5 K until 50 K and 15 K from there onwards. The dark grey areas represent regions with high Hi emissivity.
Current usage metrics show cumulative count of Article Views (full-text article views including HTML views, PDF and ePub downloads, according to the available data) and Abstracts Views on Vision4Press platform.
Data correspond to usage on the plateform after 2015. The current usage metrics is available 48-96 hours after online publication and is updated daily on week days.
Initial download of the metrics may take a while.