Fig. 4
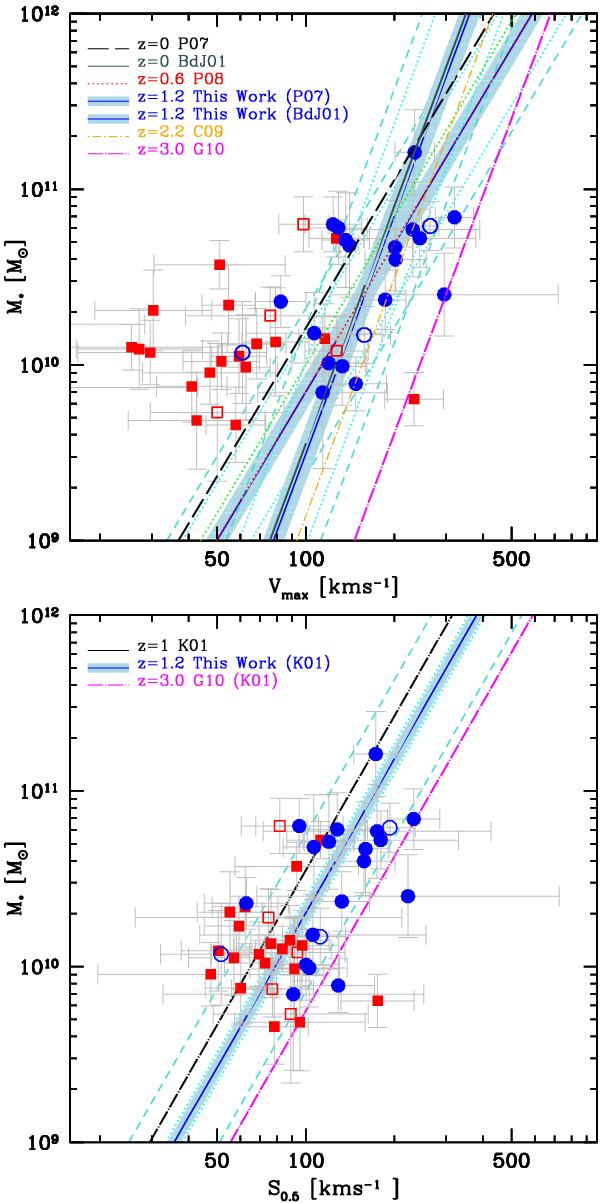
(Top) The stellar mass TF (smTF) relation at z ~ 1.2 based on the MASSIV rotating galaxies. Symbols are as in Fig. 1. Errors in the velocities are computed using GHASP simulations to account for various uncertainties. The smTF for the MASSIV rotators is calibrated using the local slope defined by either Pizagno et al. (2007, P07) or Bell & de Jong (2001, BdJ01) (dashed black line and solid black line, respectively). The solid-blue lines are the best-fit to MASSIV rotating galaxies and the cyan shaded area shows the 1σ error in the zero-point parameter (the intrinsic and total scatter is plotted as cyan dotted line and cyan dashed line, respectively). Other fits are those of Puech et al. (2008) (P08, z ~ 0.6, dotted red line), Cresci et al. (2009) (C09, z ~ 2.2, short-dashed-dotted orange line), and Gnerucci et al. (2011) (G11, z ~ 3, long-dashed-dotted magenta line). (Bottom) The relation between the stellar mass and the contribution of both ordered and chaotic motions ( , Kassin et al. 2001, K01) is shown. The cyan shaded area shows the 1σ error on the zero-point parameter, the cyan dotted line and cyan dashed line are the intrinsic and total scatter, respectively. We overplot the best-fit relation of Kassin et al. (2007) at z ~ 1 (K01, dot-dashed black line) and Gnerucci et al. (2011) at z ~ 3 (G11, dot-dashed magenta line). Symbols are as in Fig. 1.
Current usage metrics show cumulative count of Article Views (full-text article views including HTML views, PDF and ePub downloads, according to the available data) and Abstracts Views on Vision4Press platform.
Data correspond to usage on the plateform after 2015. The current usage metrics is available 48-96 hours after online publication and is updated daily on week days.
Initial download of the metrics may take a while.