Fig. 3
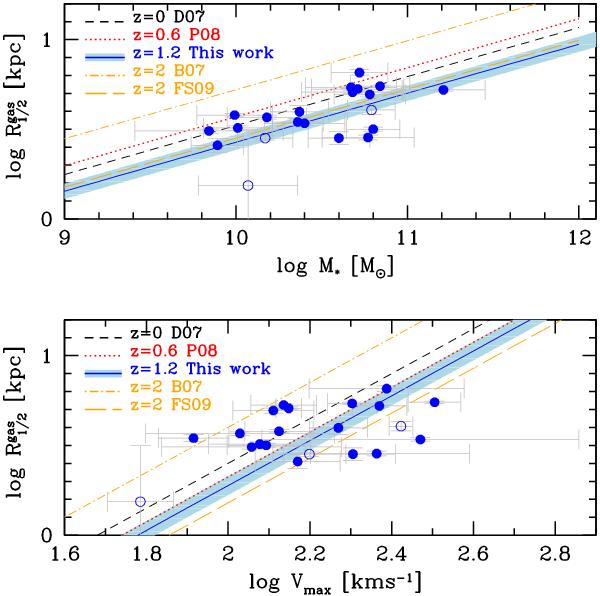
The stellar mass-size relation (top panel) and the velocity-size relation (bottom panel) for MASSIV rotating galaxies at z ~ 1.2 (solid, blue line with the 1σ error of the correlation illustrated by the light blue area). The local relation of Dutton et al. (2007, D07) is shown as a short-dashed, black line. We overplot the best-fit relations obtained by (Puech et al. 2008, P08, z ~ 0.6, dotted red line), Bouché et al. (2007), and Cresci et al. (2009) at z ~ 2 (B07, dotted-dashed orange line), and Dutton et al. (2011) using measurements of Förster Schreiber et al. (2009) (FS09, z ~ 2, long-dashed orange line). The symbols are as in Fig. 1.
Current usage metrics show cumulative count of Article Views (full-text article views including HTML views, PDF and ePub downloads, according to the available data) and Abstracts Views on Vision4Press platform.
Data correspond to usage on the plateform after 2015. The current usage metrics is available 48-96 hours after online publication and is updated daily on week days.
Initial download of the metrics may take a while.