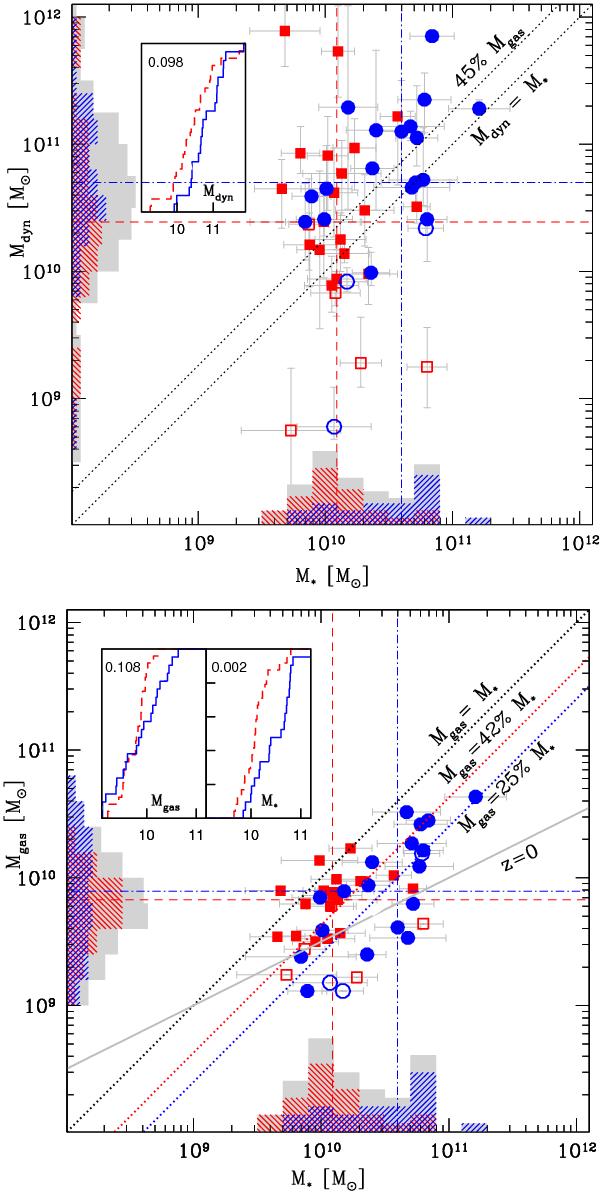
Fig. 2

The stellar mass content of MASSIV galaxies compared to both the dynamical mass derived from the dynamical modelling (top panel) and gas content derived using the Kennicutt-Schmidt formulation (bottom panel). Symbols are as in Fig. 1. The horizontal and vertical histograms represent the distribution of the stellar and dynamical masses (top) and gas mass (bottom panel). The horizontal and vertical lines are the median values of rotators (point-dashed blue line) and non-rotators (dashed red line), respectively. Dashed diagonal lines in the bottom panel comply with the condition Mgas = frac × Mstar, where frac is equal to 25% for rotating galaxies and 42% for non-rotators (or 20% and 30% of the baryonic mass, respectively). The solid line is the local relation proposed by Schiminovich (2008) using the GALEX Arecibo SDSS survey of cold HI gas. In the inserted panels, the cumulative distributions for stellar-, dynamical-, and gas-mass are plotted for rotators (solid, blue line) and non-rotators (dashed, red line) along with the probability for the two classes to be statistically different.
Current usage metrics show cumulative count of Article Views (full-text article views including HTML views, PDF and ePub downloads, according to the available data) and Abstracts Views on Vision4Press platform.
Data correspond to usage on the plateform after 2015. The current usage metrics is available 48-96 hours after online publication and is updated daily on week days.
Initial download of the metrics may take a while.


