Fig. 1
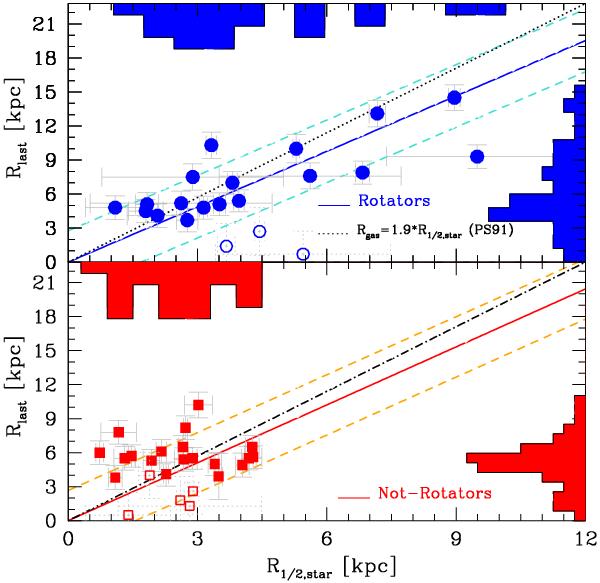
Comparison between Rlast and R1/2,star radii computed as the size of our ionized gas maps with a confidence level larger than 2σ and the half-light radius of the stellar continuum measured on the observed I-band best-seeing CFHTLS images, respectively. Within the errors, both rotators (top panel, blue circle) and non-rotators (bottom panel, red square) agree with the expected statistical trend Rlast = 1.9 × R1/2,star found by Persic & Salucci (1991, PS91) plotted with a black dotted line. The blue/red solid lines are the best-fit relation found for the rotators/non-rotating galaxies (dashed lines show the total scatter of the correlations). The empty symbols show galaxies detected with a low S/N (3 ≤ S/N ≤ 4.5).
Current usage metrics show cumulative count of Article Views (full-text article views including HTML views, PDF and ePub downloads, according to the available data) and Abstracts Views on Vision4Press platform.
Data correspond to usage on the plateform after 2015. The current usage metrics is available 48-96 hours after online publication and is updated daily on week days.
Initial download of the metrics may take a while.