Fig. 9
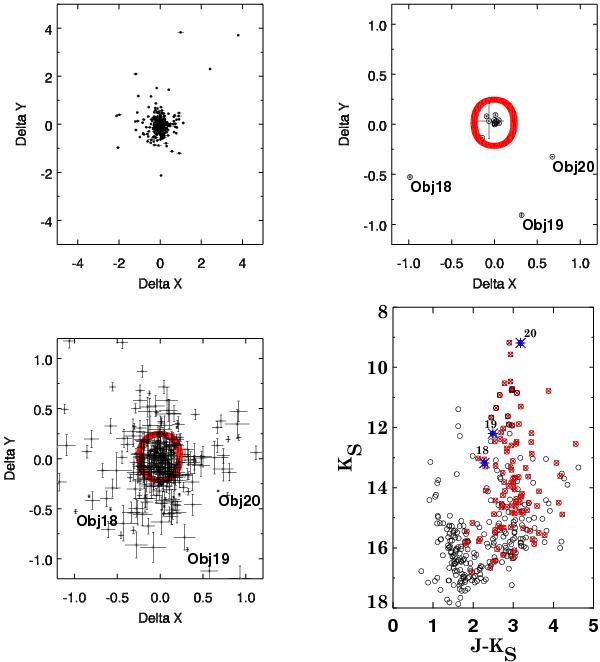
Top panels: vector point diagrams of displacement of all stars within 35 arcsec of the cluster center (left) and spectroscopically confirmed cluster members (right) in units of ISAAC pixels (185 mas/pixel) after 5 years. Bottom panels: a zoom of the central 2 × 2 pixel vector point area. The most probable cluster members are within the red circle with 0.25 pixels radius (left). They are marked with red crosses on the color−magnitude diagram of this zoomed area (right). All plots show only stars with root-mean-square positions <0.08 pixels in each coordinate, the Objs 18, 19 and 20 are also labeled.
Current usage metrics show cumulative count of Article Views (full-text article views including HTML views, PDF and ePub downloads, according to the available data) and Abstracts Views on Vision4Press platform.
Data correspond to usage on the plateform after 2015. The current usage metrics is available 48-96 hours after online publication and is updated daily on week days.
Initial download of the metrics may take a while.