Free Access
Fig. 3
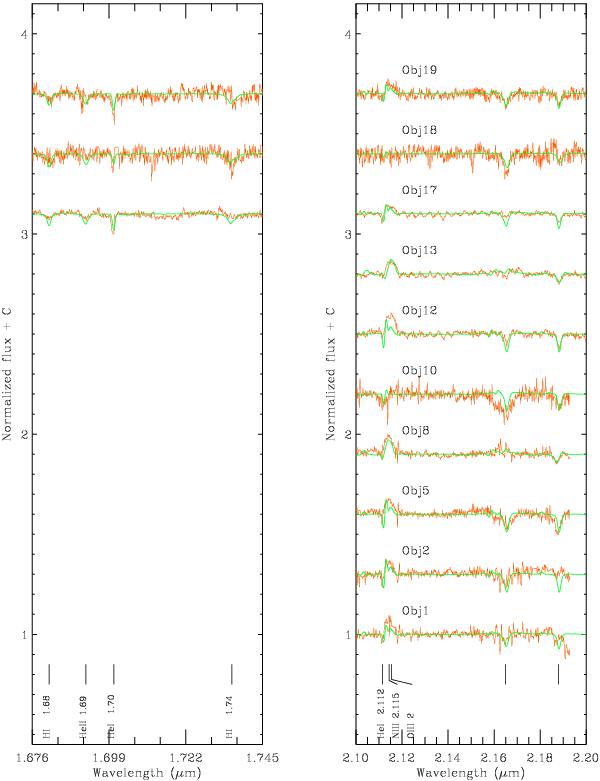
The ISAAC spectra of DBS2003 179 stars. The different spectra have been arbitrarily shifted along the flux Fλ axis for clarity. The dashed lines indicate the rest-frame wavelengths of the spectral features. The best-fitting models (green) are overplotted on the observed spectra (red).
Current usage metrics show cumulative count of Article Views (full-text article views including HTML views, PDF and ePub downloads, according to the available data) and Abstracts Views on Vision4Press platform.
Data correspond to usage on the plateform after 2015. The current usage metrics is available 48-96 hours after online publication and is updated daily on week days.
Initial download of the metrics may take a while.