Free Access
Fig. 13
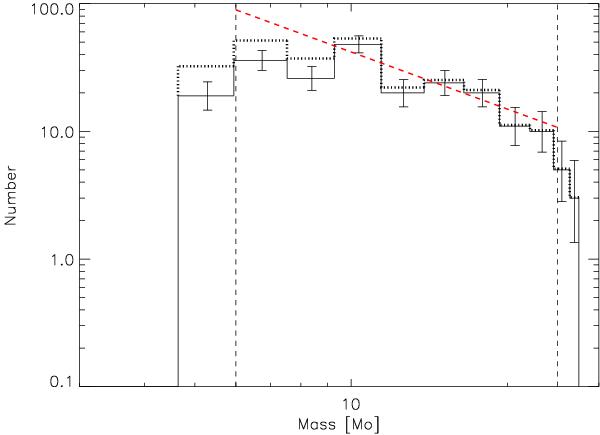
IMF of DBS2003 179. The slope is calculated between the mass limits denoted by vertical dashed lines. The completeness-corrected values are shown as a dotted histogram. Overplotted as a red dashed line is the least-squares fitted slope (based on the completeness-corrected histogram).
Current usage metrics show cumulative count of Article Views (full-text article views including HTML views, PDF and ePub downloads, according to the available data) and Abstracts Views on Vision4Press platform.
Data correspond to usage on the plateform after 2015. The current usage metrics is available 48-96 hours after online publication and is updated daily on week days.
Initial download of the metrics may take a while.