Free Access
Fig. 10
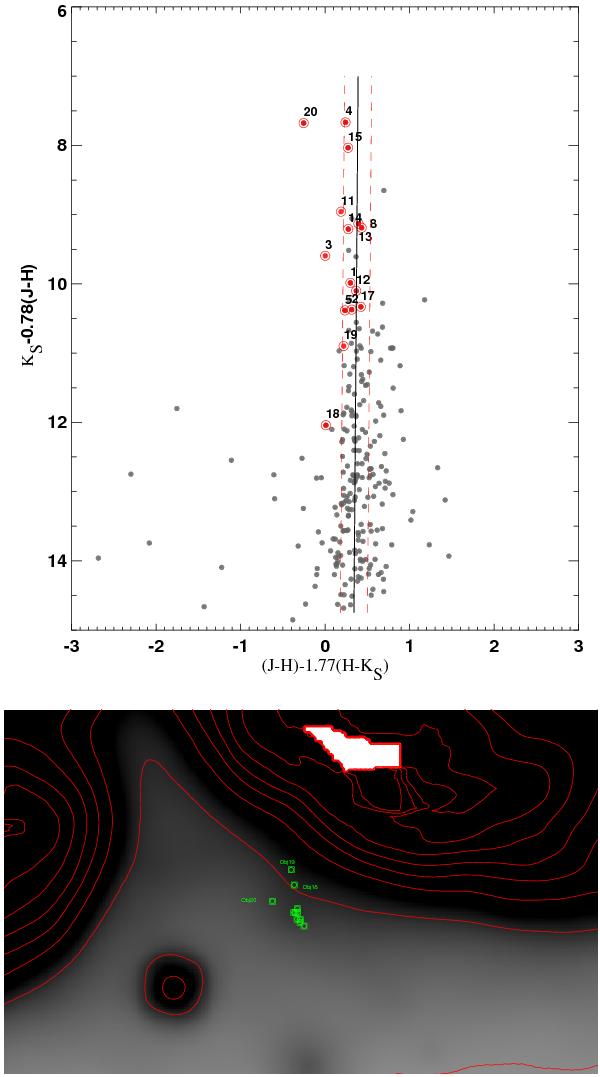
Upper panel: the reddening free color of (J−H)−1.77(H−KS) vs. KS−0.78(J−H) magnitude. The solid line is a mean cluster line, while the dashed lines represent 3σ deviation. Bottom panel: WISE 22 μm image with density contours overplotted. The stars with spectra are labeled.
This figure is made of several images, please see below:

Current usage metrics show cumulative count of Article Views (full-text article views including HTML views, PDF and ePub downloads, according to the available data) and Abstracts Views on Vision4Press platform.
Data correspond to usage on the plateform after 2015. The current usage metrics is available 48-96 hours after online publication and is updated daily on week days.
Initial download of the metrics may take a while.