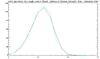
Fig. 3
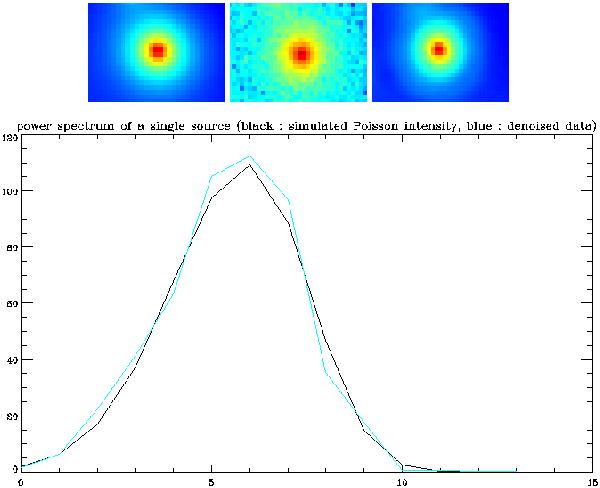
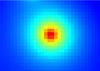
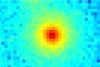
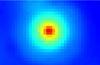
Spectrum of a single gamma-ray point source recovered using the multichannel MS-VSTS denoising algorithm. Top: single gamma-ray source from simulated Fermi data integrated along the energy axis (left: simulated source; middle: noisy source; right: denoised source). Bottom: spectrum of the center of the point source: intensity as a function of the energy band with 14 energy bands between 50 MeV and 50 GeV (black: true simulated spectrum; cyan: restored spectrum from our denoising algorithm.
Current usage metrics show cumulative count of Article Views (full-text article views including HTML views, PDF and ePub downloads, according to the available data) and Abstracts Views on Vision4Press platform.
Data correspond to usage on the plateform after 2015. The current usage metrics is available 48-96 hours after online publication and is updated daily on week days.
Initial download of the metrics may take a while.