Free Access
Fig. 1
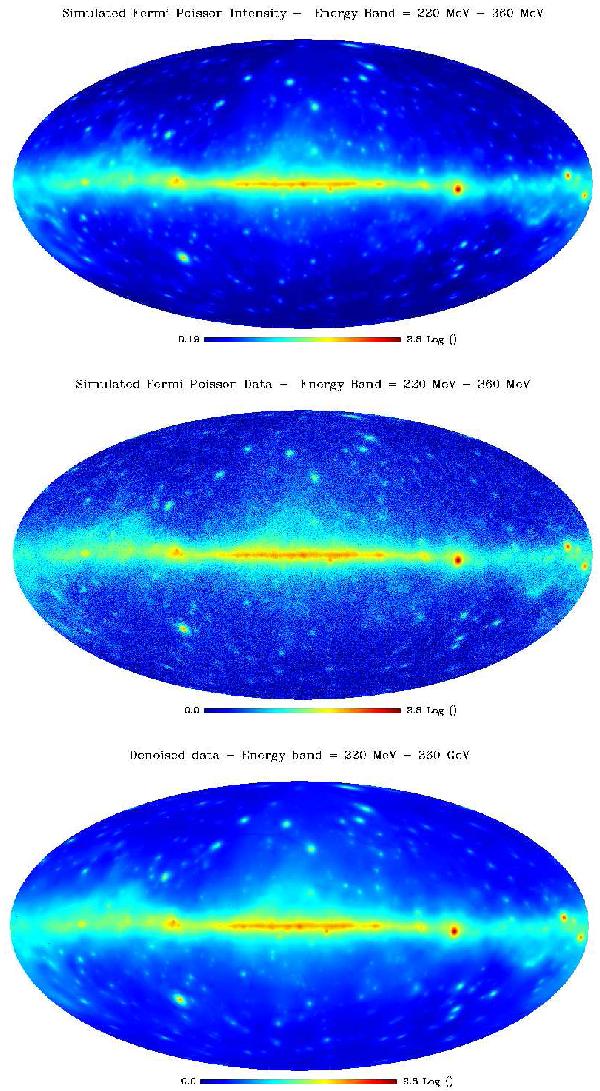
Result of the multichannel Poisson denoising algorithm on simulated Fermi data over the energy band 220–360 MeV. Top: simulated intensity skymap. Middle: simulated noisy skymap. Bottom: denoised skymap. Maps are on a logarithmic scale.
Current usage metrics show cumulative count of Article Views (full-text article views including HTML views, PDF and ePub downloads, according to the available data) and Abstracts Views on Vision4Press platform.
Data correspond to usage on the plateform after 2015. The current usage metrics is available 48-96 hours after online publication and is updated daily on week days.
Initial download of the metrics may take a while.