Fig. 3
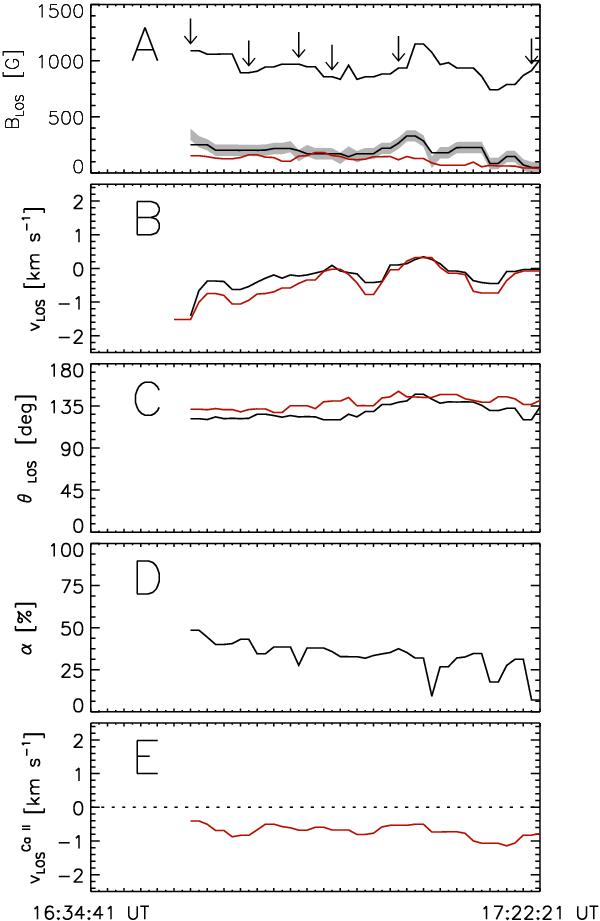
Temporal evolution of the physical properties of P1. Panel A: magnetic field intensity derived from the inversions (black line); LOS magnetic flux density from COG (red line) and from the inversions (black thin line); the shadow represents a range of ± 50 G around the magnetic flux density values from the inversions. Panel B: photospheric LOS velocity derived from the inversions (black line) and from the Stokes V zero-crossing (red line). Panel C: LOS magnetic field inclination derived from the inversions (black line) and from the strong field approximation (red line). Panel D: magnetic filling factor derived from the inversions. Panel E: chromospheric LOS velocity derived from the core shift of Ca ii line. The arrows mark the times corresponding to the frames shown in Fig. 2 from second column on. Minor horizontal tick marks are spaced 52 s.
Current usage metrics show cumulative count of Article Views (full-text article views including HTML views, PDF and ePub downloads, according to the available data) and Abstracts Views on Vision4Press platform.
Data correspond to usage on the plateform after 2015. The current usage metrics is available 48-96 hours after online publication and is updated daily on week days.
Initial download of the metrics may take a while.