Fig. 2
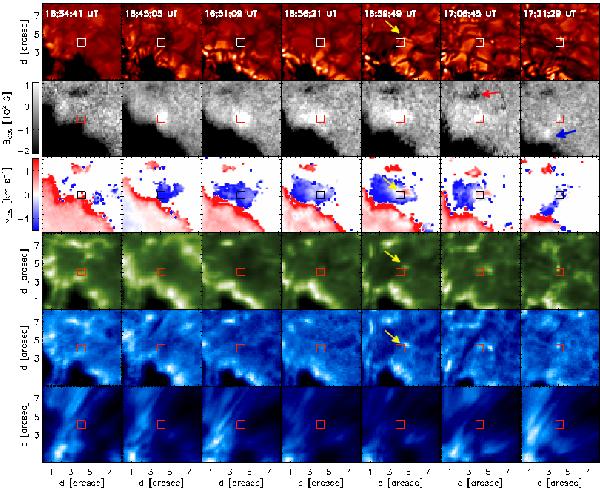
Representative 8 × 8 arcsec2 frames extracted from the complete temporal evolution of P1. From the top to the bottom: G-band filtergrams; LOS magnetograms (clipped at + 100 and −200 G) derived with COG; LOS velocity fields as derived from the Stokes V zero-crossing point (clipped at ± 1.5 km s-1); Fe i core images; Ca ii wing images; Ca ii core images. The red box is centered on the maximum of the LOS magnetic flux within P1. Yellow arrows in the fifth column mark the formation of bright features in filtergrams and G-band frames and the corresponding formation of a downflow within the MMF. The red arrow on the magnetogram of the sixth column marks a small magnetic region of opposite polarity with respect to P1. The blue arrow on the LOS magnetogram of the last column marks P2. Frames from the second column on correspond to the times marked by arrows in Fig. 3.
Current usage metrics show cumulative count of Article Views (full-text article views including HTML views, PDF and ePub downloads, according to the available data) and Abstracts Views on Vision4Press platform.
Data correspond to usage on the plateform after 2015. The current usage metrics is available 48-96 hours after online publication and is updated daily on week days.
Initial download of the metrics may take a while.