Fig. 1
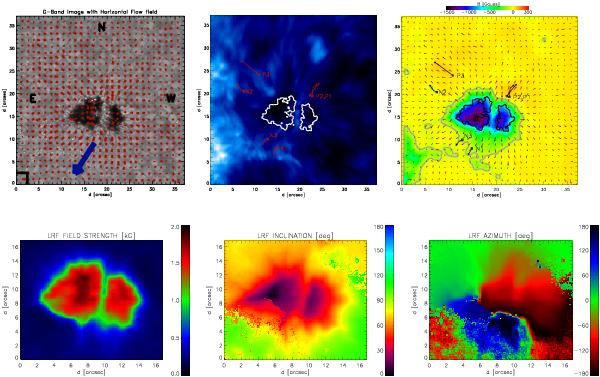
Top left: LCT horizontal velocity field averaged over 70 min superposed on a G-band image. The length of the red arrow in the lower-left corner of the image corresponds to a velocity of 1 km s-1, while the black box shows the dimension of the correlation window used for the LCT computation. The blue arrow indicates approximate disk center direction. Top middle: corresponding FOV in the core of Ca ii line. Top right: horizontal velocity field superposed on the median value (computed over 70 min) of LOS magnetic flux; gray lines mark the regions where the magnetic flux is equal to −100 G. The little red (middle) and black (left) squares and arrows show the starting positions and trajectories of the six tracked MMFs. Bottom Left: magnetic field strength. Bottom middle: inclination angle in the LRF. Bottom right: azimuth angle in the LRF.
Current usage metrics show cumulative count of Article Views (full-text article views including HTML views, PDF and ePub downloads, according to the available data) and Abstracts Views on Vision4Press platform.
Data correspond to usage on the plateform after 2015. The current usage metrics is available 48-96 hours after online publication and is updated daily on week days.
Initial download of the metrics may take a while.