Fig. 4
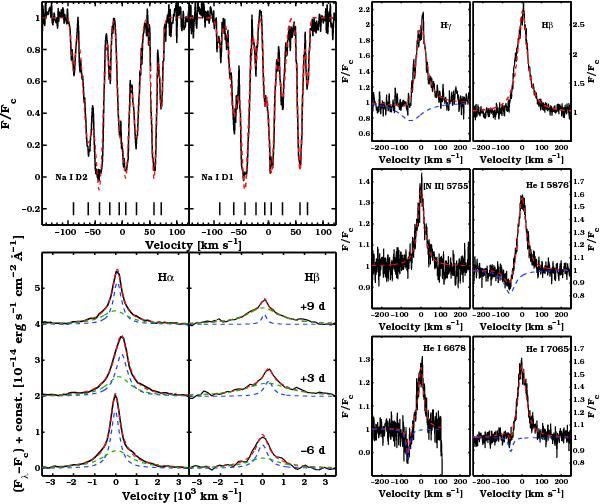
(Top-left panels) Na i D absorption features in the high resolution spectrum of SN 2008J. Several components are present and their peak positions are indicated by black solid lines. The features are fit with the sum of 9 Gaussian functions, the best fit is shown in red. Velocity is plotted in the SN rest frame, as determined from the narrow emission line peaks in the same high resolution spectrum. (Bottom-left panels) Hα and Hβ sequences from the low resolution spectra, shown after low-order polynomial continuum subtraction. Each profile is well fit by the sum (in red) of two Lorentzian components (in blue and green). (Right panels) Narrow emission lines in the high-resolution spectrum of SN 2008J. Each line has been fit with a Lorentzian profile for the emission and one for the absorption when detected. The absorption component is shown in blue, the total best fit in red. The spectrum is presented in velocity scale, where the zero velocity corresponds to the emission peak position.
Current usage metrics show cumulative count of Article Views (full-text article views including HTML views, PDF and ePub downloads, according to the available data) and Abstracts Views on Vision4Press platform.
Data correspond to usage on the plateform after 2015. The current usage metrics is available 48-96 hours after online publication and is updated daily on week days.
Initial download of the metrics may take a while.