Fig. A.1
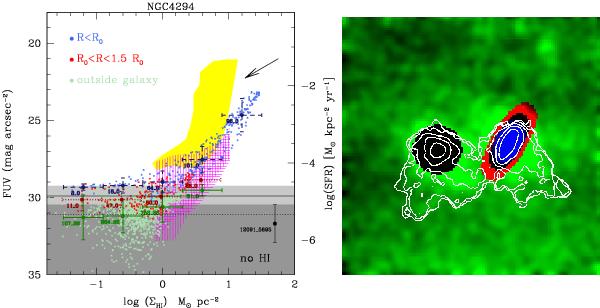
On the left, the relationship between FUV surface brightness and H i surface density is shown for NGC 4294. The colors indicate which of the three defined regions the pixels belong to: inner galaxy in blue, outer galaxy in red and external gas in green (as shown in the right-hand panel). The 1(3)σ FUV sky surface brightness level is indicated by the horizontal dotted (solid) line. The points with the error-bars indicate, from top to bottom, the mean and its dispersion within the H i surface density bins for each of the three regions (inner galaxy, extended galaxy and external gas). We have not applied any inclination corrections to these data. However, the arrow indicates how the pixel values should be corrected to account for inclination (based on the major/minor axis ratio of the galaxy). The correction in the FUV is very uncertain however, because it assumes the galaxy is optically thin. The two numbers on the left of each error bar, separated by an underscore symbol, indicate (left) the number of pixels used for this point, and (right) the number of pixels with a flux below the mean sky level in the bin. As using the latter pixels would give an infinite surface brightness they are not included in the computation of mean surface brightness. A large value for this second number is a good indication that we are very close to the sky value. The error bar near the lower-right corner (labeled “no H i”) shows the result of the same analysis when performed on the FUV emission outside the detected H i only, and provides an indication of our FUV detection limit (the dark- and light- grey shaded areas show, respectively, the corresponding 1 and 2σ limits). The yellow-shaded area indicates the location of nearby field galaxies from the THINGS sample (Bigiel et al. 2008). The vertically and horizontally shaded areas correspond respectively to dwarf galaxies and the outer parts of spirals, i.e., the points with error bars in Fig. 8 of Bigiel et al. (2010). A similar diagram for our complete sample is shown in our Fig. 3.
Current usage metrics show cumulative count of Article Views (full-text article views including HTML views, PDF and ePub downloads, according to the available data) and Abstracts Views on Vision4Press platform.
Data correspond to usage on the plateform after 2015. The current usage metrics is available 48-96 hours after online publication and is updated daily on week days.
Initial download of the metrics may take a while.