Fig. 4
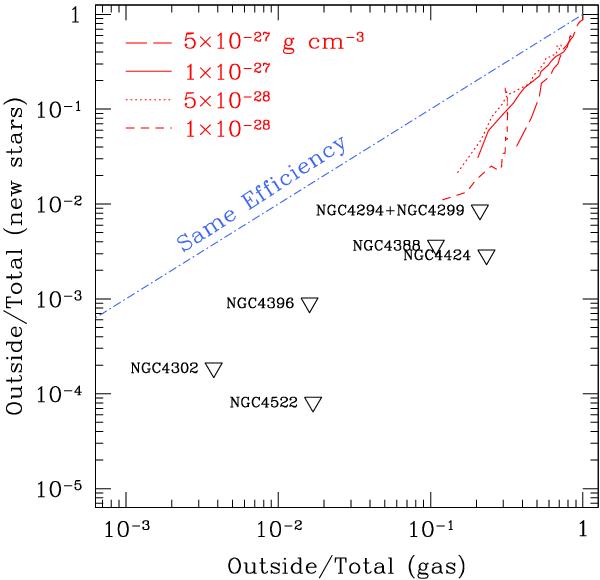
Mass fraction of newly formed stars outside the galaxy as a function of the fraction of H i gas outside the galaxy. The blue line indicates the 1:1 relationship which would be followed if star formation had the same efficiency inside and outside of galaxies. The red curves show the evolution of the Kapferer et al. (2009) models for a relative velocity of 1000 km s-1 between the galaxies and the ICM (appropriate for the Virgo cluster), for different surrounding densities, as indicated in the top-left corner (for comparison, the average Virgo cluster density is 3 × 10-27 g cm-3, see Boselli & Gavazzi 2006). The triangles show the same fractions computed for the galaxies in our sample, using the FUV light (corrected for internal extinction, see Sect. 3.3) and the H i mass (assuming it traces the total gas mass).
Current usage metrics show cumulative count of Article Views (full-text article views including HTML views, PDF and ePub downloads, according to the available data) and Abstracts Views on Vision4Press platform.
Data correspond to usage on the plateform after 2015. The current usage metrics is available 48-96 hours after online publication and is updated daily on week days.
Initial download of the metrics may take a while.