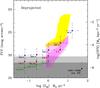
Fig. 3
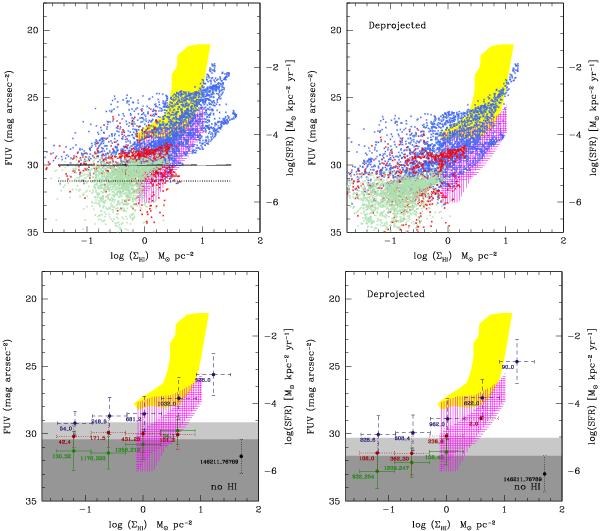
Relationship between FUV surface brightness and H i surface density, ΣHI, in our full sample. The scale on the left shows surface brightness (in mag arcsec-2), while the scale on the right shows log(SFR) (in M⊙ yr-1 kpc-2), assuming the same FUV-SFR conversion as in Bigiel et al. (2010). Top row: blue/red/green points indicate pixels within, respectively, the inner galaxy, the extended galaxy and the external gas (see Sect. 2.3 for the definition of these regions). The typical 1(3)σ limit in FUV surface brightness is indicated by the horizontal dotted (solid) line. Bottom row: the points with the error bars indicate, from top to bottom, the mean and its dispersion within the H i surface density bins for each of the three regions (inner galaxy, extended galaxy and external gas). The two numbers on the left of each error bar, separated by an underscore symbol, indicate (left) the number of pixels used for this point, and (right) the number of pixels with a flux below the mean sky level in the bin. As using the latter pixels would give an infinite surface brightness they are not included in the computation of mean surface brightness. A large value for this second number is a good indication that we are very close to the sky value. The error bar in the lower-right corner (labeled “no H i”) shows the result of the same analysis when performed on the FUV emission outside the detected H i only, which gives an indication of the detection limit with this method (the dark- and light-grey shaded area show, respectively, the corresponding 1 and 2σ limits). The yellow-shaded area indicates the location of the nearby field galaxies from the THINGS sample, from Bigiel et al. (2008). The vertically and horizontally shaded areas correspond respectively to dwarf galaxies and the outer parts of spirals (i.e., the points with error bars shown in Fig. 8 of Bigiel et al. 2010). The two left-hand panels correspond to the directly observed surface brightnesses and surface densities, while in the right-hand panels a geometrical correction was applied for the inclination of each galaxy. Similar figures are shown in the appendix for each of our galaxies.
Current usage metrics show cumulative count of Article Views (full-text article views including HTML views, PDF and ePub downloads, according to the available data) and Abstracts Views on Vision4Press platform.
Data correspond to usage on the plateform after 2015. The current usage metrics is available 48-96 hours after online publication and is updated daily on week days.
Initial download of the metrics may take a while.