Fig. 1
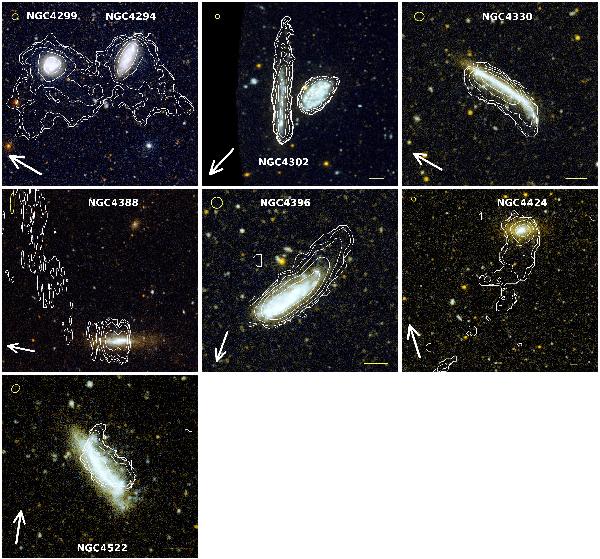
FUV/NUV images with H i surface density contours superimposed. The contours shown correspond to H i surface density levels of log ΣHI(M⊙ pc-2) = −1, −0.5,0,0.5 and 1. The H i beam is shown as an ellipse in the top-left corner of each panel. The horizontal bar in the bottom-right corner of each panel indicates a scale of 1 arcmin (or 4.9 kpc at the assumed cluster distance of 17 Mpc). The arrow indicates the direction of the cluster center.
Current usage metrics show cumulative count of Article Views (full-text article views including HTML views, PDF and ePub downloads, according to the available data) and Abstracts Views on Vision4Press platform.
Data correspond to usage on the plateform after 2015. The current usage metrics is available 48-96 hours after online publication and is updated daily on week days.
Initial download of the metrics may take a while.