Fig. 9
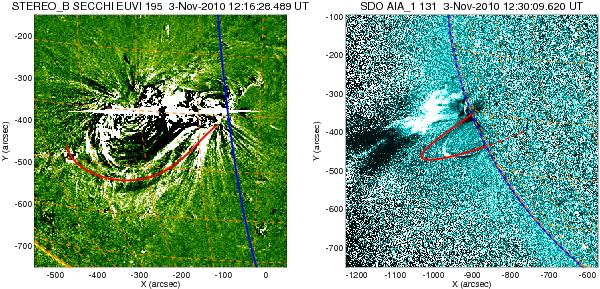
Left: STEREO-B EUVI 195 Å difference image (at the time indicated with respect to 12:11:28.475 UT). Right: SDO AIA 131 Å image ratio (at the time indicated with respect to a previous image at 12:18:57.620 UT). Overlaid are the loop trace (red thick line with dashed lines for portion behind the limb in right panel), the SDO limb (blue) and heliospheric grid lines spaced by 10 degrees (orange dashed lines).
Current usage metrics show cumulative count of Article Views (full-text article views including HTML views, PDF and ePub downloads, according to the available data) and Abstracts Views on Vision4Press platform.
Data correspond to usage on the plateform after 2015. The current usage metrics is available 48-96 hours after online publication and is updated daily on week days.
Initial download of the metrics may take a while.