Fig. 6
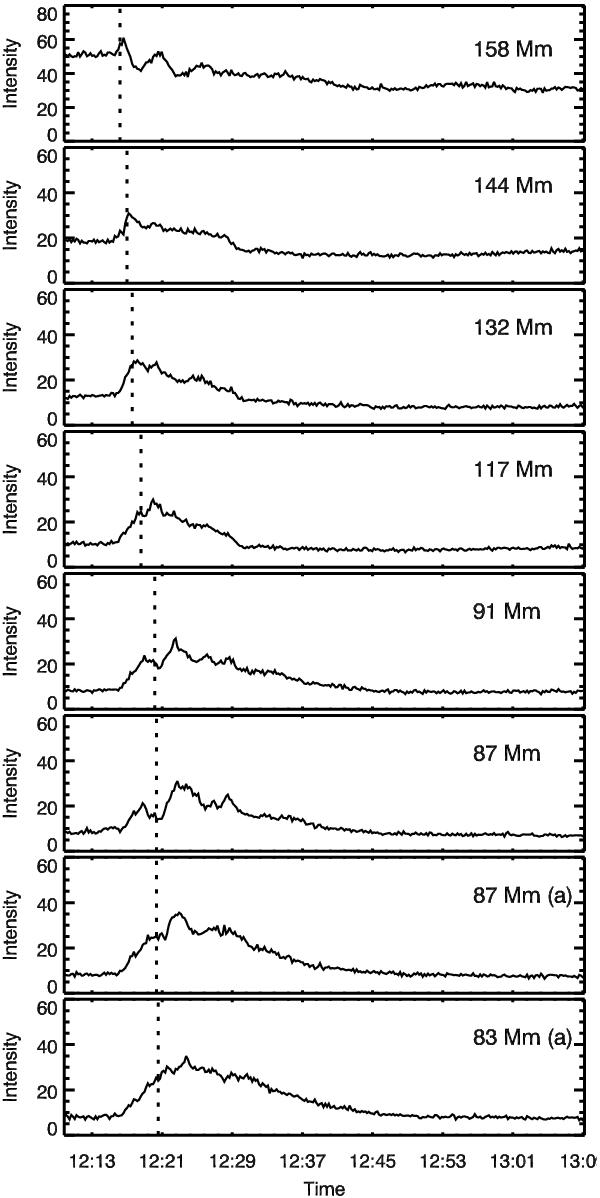
Intensity along the loop oscillation path extracted from time-distance images by taking the intensity at each point along the displacement time curves for eight values of s along the loop. (a) Indicates that the intensity is extracted from the second strand which was observed in six of the time-distance images, the results of which are represented as triangles in Fig. 5. The vertical dotted line represents the position in time of the linear fit to the intensity shown in Fig. 8.
Current usage metrics show cumulative count of Article Views (full-text article views including HTML views, PDF and ePub downloads, according to the available data) and Abstracts Views on Vision4Press platform.
Data correspond to usage on the plateform after 2015. The current usage metrics is available 48-96 hours after online publication and is updated daily on week days.
Initial download of the metrics may take a while.