Fig. 5
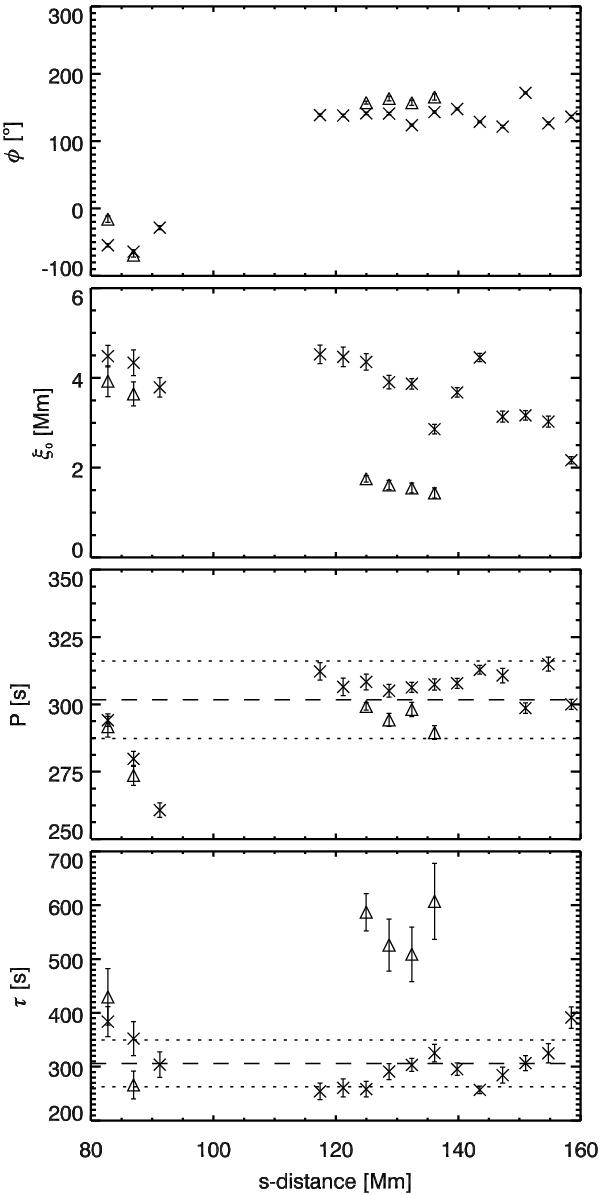
Oscillation parameters, phase (φ), projected displacement amplitude (ξ), period (P), and damping time (τ) plotted as a function of s along the loop. The triangles show the results obtained for the second loop strand observed in six of the time-distance images. The error bars show the errors given by the fitting technique. The horizontal dashed line in the bottom two plots indicate the mean value of P and τ for the first loop strand and the horizontal dotted lines indicate the standard deviation. The reference time is 12:16:33 UT.
Current usage metrics show cumulative count of Article Views (full-text article views including HTML views, PDF and ePub downloads, according to the available data) and Abstracts Views on Vision4Press platform.
Data correspond to usage on the plateform after 2015. The current usage metrics is available 48-96 hours after online publication and is updated daily on week days.
Initial download of the metrics may take a while.